Financial Performance in the options collateral Pools
Priced with probabilities
Measuring the financial performance in the collateral pool is not as straight-forward as for the other liquidity pools. Options are playing with odds, and the well-known BS options pricing model is based on the theory of probabilities. Based on the mathematical statistics, the writers are more likely to win in general if the options are properly priced, but in real application scenarios, things could be more complicated. The pool is the writer of all options with different terms: it is a mutual fund for writing options. It could take months or even years to prove the reliability and stability of the returns in the options collateral pool — but there are still ways to run some tests on what the financial picture will look like in the pool.
It is widely accepted that cryptoassets like Bitcoin (BTC) and Ethereum (ETH) are extremely volatile. Therefore, it would be reasonable to comprehend that options could be more friendly and beneficial to the holders rather than the sellers, as they only have rights without obligations, and the cost is capped to the premium.
Is this true?
How to measure the Financial Performance in the Pools
Before we jump into the mathematics, it is important to understand that volatility is an important parameter for pricing options. Options will be more expensive in more volatile assets. It is often known as implied volatility in pricing options in the BS model. Here in the following analysis, we use the historical average volatility to price options.
First, for BTC options, we calculate the historical average volatility in 2.5 years between Mar. 29, 2017 and Nov. 26, 2019, including a volatility of 1 day, 2 days, 3 days, 7 days, 15 days and 30 days.
Second, we calculate the price of ATM options with each expiration date with the volatility above, in the past 12 months, from Nov. 27, 2019 to Nov. 27, 2020.
Third, suppose the same amount of puts and calls is written by the pool, we can derive the P&L for the sellers in each expiry in the same period.
Last, we allocate different weights to the options in different expiry, referring to the transaction volume on Deribit. We can derive the pool’s average expected APR and the maximum drawdown.
Results in BTC and ETH Options Pools
The details of calculation can be found here.
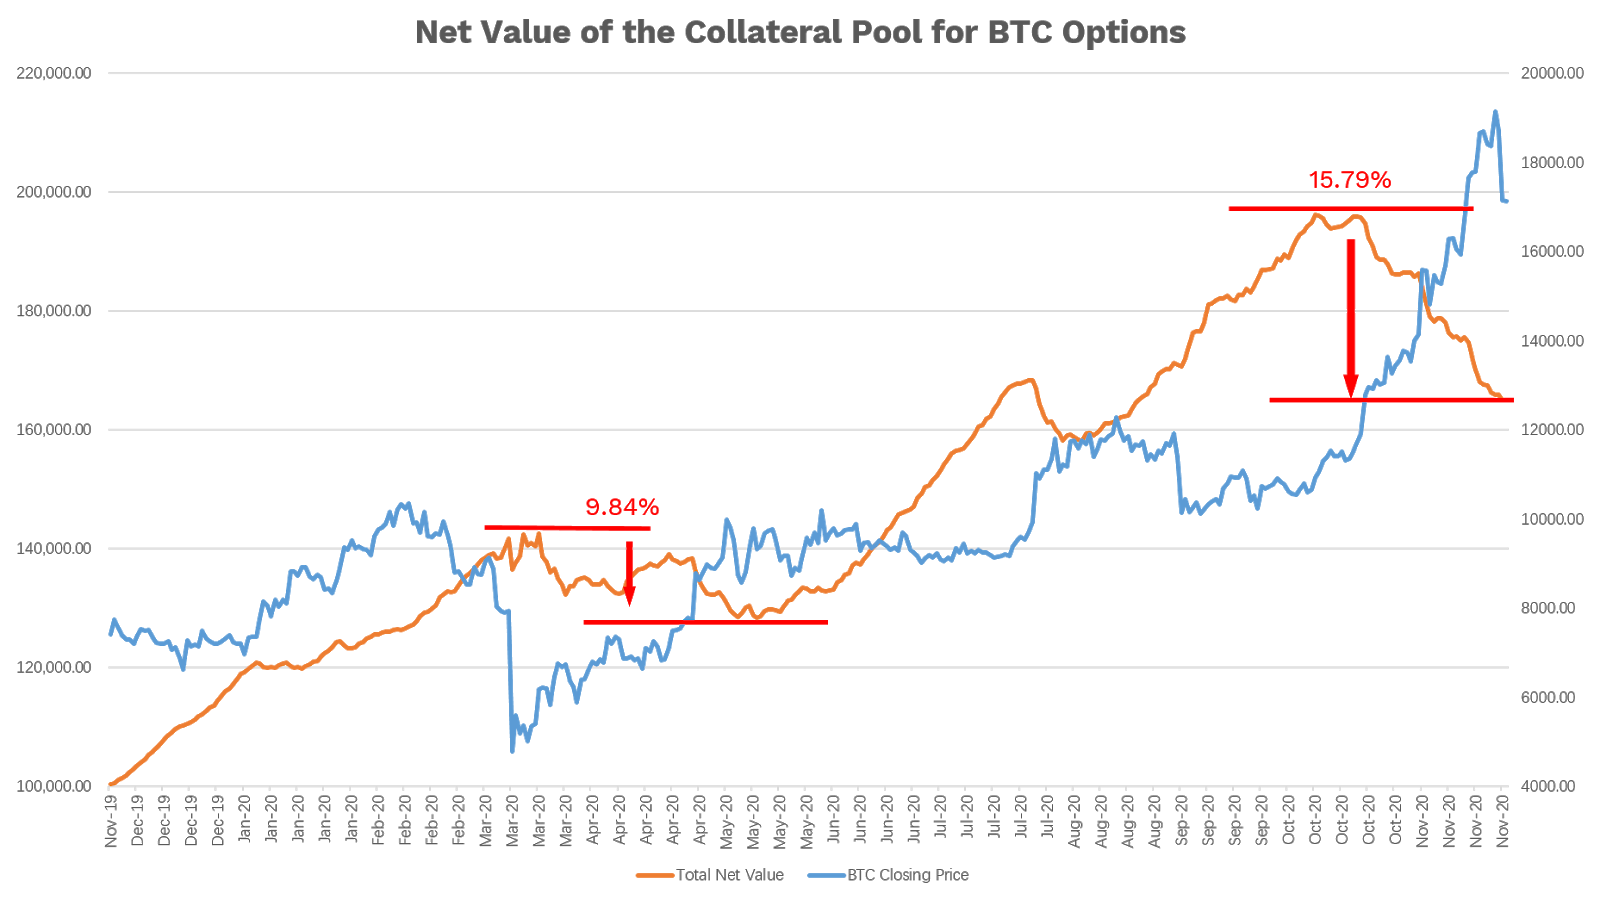
The pool as the collective option seller will be more likely to win in the long run, despite the occasional drawdowns. In the past 12 months, the pool’s net value increased by over 60%, which means a 60% APR in return. Of course, this measurement is using the hypothesis that the pool as collateral is fully utilized. For an average 50% utilization ratio, the expected average APR will be 30%, also with smaller drawdowns.
From the chart above, in case of a relatively long time of unilateral price movement, the pool will suffer losses, especially from March to May 2020 and from October to November 2020 in the test period.
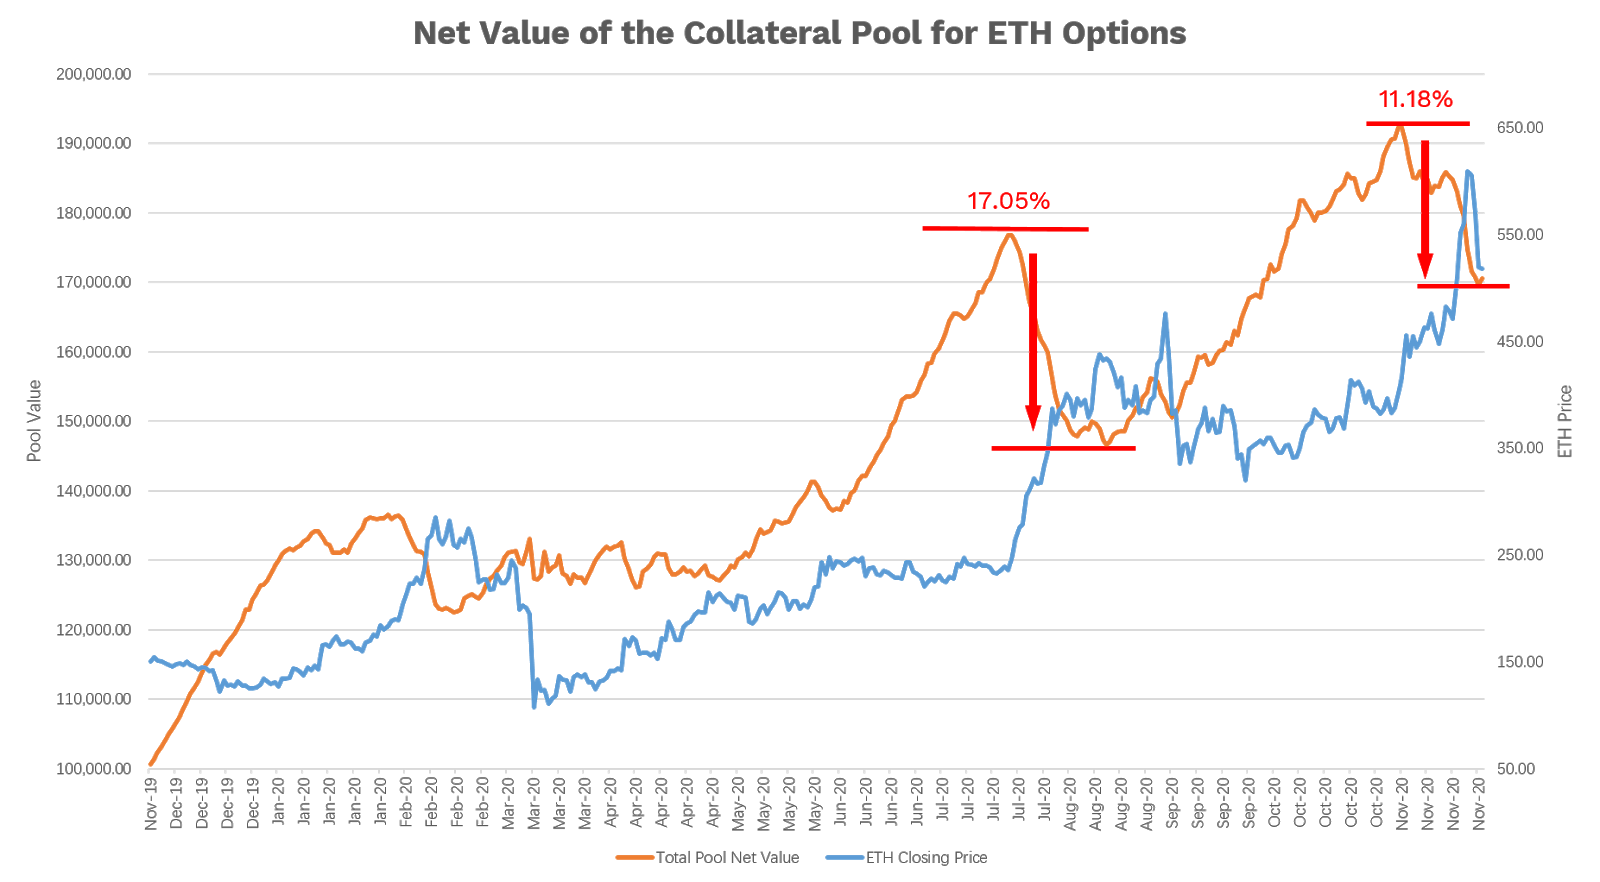
Similarly, with the same methodology, we can simulate the finance performance of a pool for ETH options in the recent 12 months as below. The details of simulation can be found here.
Summary
Collateral pools for options behave differently from better known lending and AMM liquidity pools. The pools provide liquidity and collateral for options, while rewarded with option premiums and undertaking risks. It is possible to lose money in cases of the unilateral market price movement of the underlying assets. But in the long run, it could bring some favorable rewards for the liquidity providers.